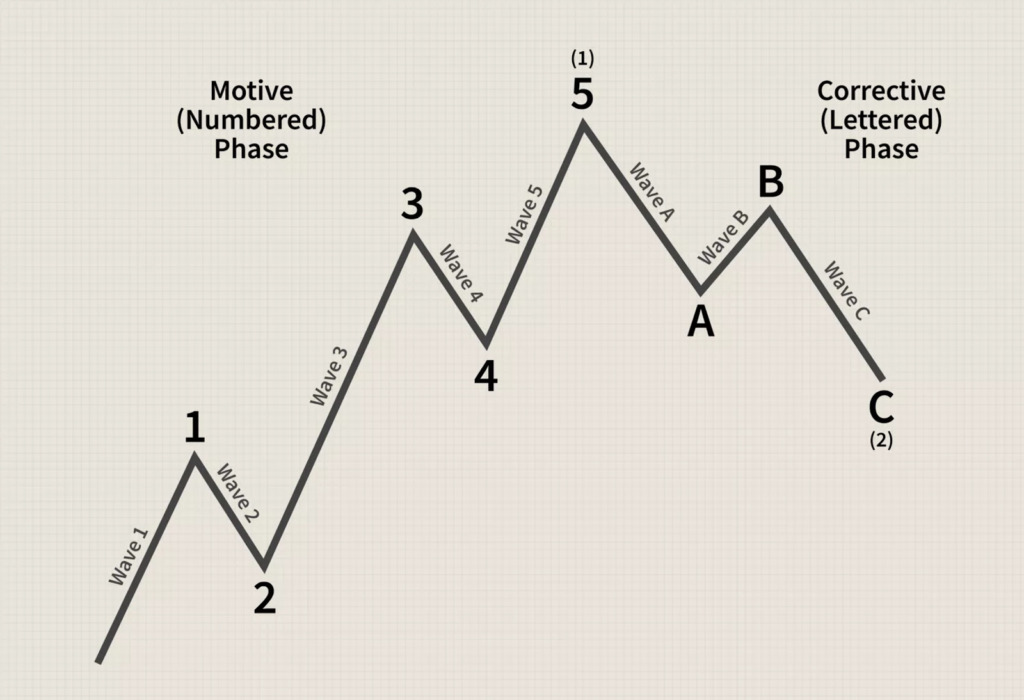

In 1935, the Elliot wave theory gained popularity after Ralph Nelson Elliott predicted the market bottom of a stock. Until now, there has been a fluctuation in the financial market, which has remained somewhat of a mystery. However, theorists in the early 1900s attempted to correlate the behavior of the market with nature. This concept—of biomimicry has provided a basis for applying the Elliot wave theory of currency flow analysis.
When it comes to analyzing the market movement, Ralph Nelson Elliott has been considered a worthy successor to Charles Dow. Not only did he confirm many of Dow’s studies, but he also came up with a series of accurate definitions for different market phases.
Notably, Elliot added an array of elements, which in addition to identifying market trends, also calculate price levels that can be achieved. Similar to the Dow theory, the Elliot wave principle can distinguish the movement of prices in waves.
Lastly, this approach is targeted at discovering laws that oversee natural phenomena, part of which the stock market belongs.
How does the Elliott wave of currency flow and trading work?
This theory proposes that the price movement of stocks is predictable because they move in a repeated pattern (up and down). The waves formed are created by sentiment or the psychology of the investor. Professional traders and stock market analysts continually attempt to profit from several wave patterns made from price movements using this wave theory.
This hypothesis further identifies two types of waves: impulsive and corrective waves. These waves are subjective, implying that traders will interpret them in unique ways.

Impulse Waves
Impulse waves have five different sub-waves that constitute overall price movement in the same direction (up or down), trailing the trend of the next-largest degree. This price pattern is prevalent and doubles the easiest to identify in the stock market.
Three sub-waves are notice waves, while the remaining two are corrective waves.
Below are three unbending rules that govern the formation of impulsive waves:
—Wave number 2 cannot retrace above 100% of wave number one.
—Wave number 3 cannot be shorter than wave numbers 1 and 5
—Wave number 4 cannot go past wave number 3 at any time.
If there is a violation of any of these rules, it means it is not an impulsive wave. Traders would be required to label the wave again.
Corrective Waves
Corrective waves are sometimes referred to as diagonal waves that have a combination of three sub-waves that move in opposite directions to the next-largest degree trend. The goal of corrective waves is to push the market toward the direction of the movement.
The impulsive and corrective waves are packed in a fractal to form more significant patterns. Take, for instance, a chart with a one-year time frame that could have a corrective wave, while a chart with a 30-day timeframe has an impulsive wave developing. The distinctiveness of this wave is that it has diagonals that can appear like a contracting or expanding wedge.
A trader who understands the interpretation of the Elliott wave theory of currency flow and exchange may have an outlook of a short-term bull and long-term bear market.
Limits to the Elliot wave principle
Ralph Nelson Elliott discovered that the money market responds primarily to significant changes in the psychology of analysts. This makes it more sentimental.
Since human psychology plays a crucial role in this theory, the nature of the market movement is also expected to sustain a constant flow.
Although the Elliott wave principle is quite appealing on paper, it is often faced with the reality of the money market. Thus, counting the waves will be almost impossible without defying the strict rules of this theory.
This has made analysts who follow this method opt for an approach that is flexible and has a more detailed interpretation of market price movement.

How to trade using the Elliott wave theory
Let’s consider a case scenario where a trader notes that a stock or asset starts to move on an impulsive upward wave. The trader may buy long on the stock until the fifth wave is complete.
At this level, a reversal is expected, then the trader chooses to sell short on the same stock or asset. This theory is the underlying idea behind the recurrence of fractal patterns in the financial market.
Conclusion
To conclude this subject matter, the Elliott wave theory is a handy indicator that puts investors and traders alike in a vantage point to make a profit from the financial market. It also recommended that backup strategies are deployed in tandem with this theory to check and balance inconsistencies in the market for maximum yield.


